So, today I want to discuss using Google Docs to create a form/quiz/information gather that also has a chart display for the results. This was definitly the show stealer at my recent OAPT presentation. So, here goes.
1. Get a Google Account. Visit Google and click on Sign In in the upper right corner. On the next page choose Create an Account Now. Your new Google Account gives you access to GMail, Google Docs, Google Reader, and Google Calender to name a few.
2. Click on Google Docs in the upper left (may be under More).
3. In Google Docs, click on Create New and select Spreadsheet. A new window will open. Click Form -> Create a Form. Create the form you are interested in (quiz, introduction form, feedback form). For the purposes of these directions, you will need to create questions that have distinct answers (T/F, MC, likert-style).
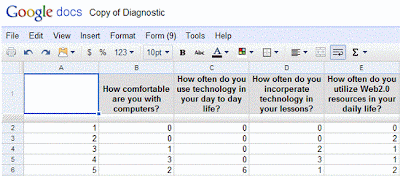
4. Back in your spreadsheet (which should now have your questions as column headings), click on New Sheet in the bottom left. This new sheet will be used to tally the results from your form. For this example, I am assuming that you created likert-style questions with a 5 point scale (this works best when all the questions have the same style and scale).
5. The values in row 1 should be the questions from your form (or abbreviated versions of them). The questions should start at B1. In the first column (starting in A2) start the scale for your question.

6. Now, we need to add in some formulas to count the responses. For example, in B2 I add a formula that counts all of the responses to the first question that were 1 (this example assumes you renamed the sheet that stores the data from the form as RawData).
=COUNTIF(RawData!B$2:B$103, $A2)
The COUNTIF function will count the data in the range (the first thing in the brackets) only if the value is equal to the second thing in the brackets. The RawData!B$2:B$103 is the range that the function looks over, cells B2 through B103 (this would allow for 102 responses) in the RawData sheet. The $ in front of the number ensures that the numbers do not change when we fill the equation down. The $A2 refers to the 1 placed in that cell, which is the value we want to count.
7. Fill the equation down by clicking the blue square in the corner of the cell highlight box and dragging down. Repeat for the remainder of your questions (by filling across).
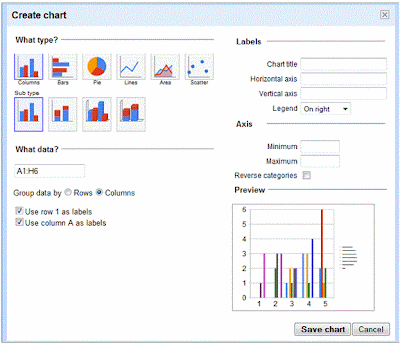
8. Now we need to build a chart for our data. Start by selecting all of the data in the new sheet you have just finished making. Select Insert -> Chart to open the chart wizard. Set the Group Data by option to Columns, and ensure that both Use row 1 as labels and Use column A as labels are checked. Click save chart.

9. The chart will appear in the current sheet. Right-click the chart and select Move to own sheet.
10. Now you just need data to be processed into your beautiful chart. Click the Form option in the tool bar and choose Go to live form. This is the page that you can send to the people who you would like to fill out the form. Just copy the web address (the http://spreadsheets.google.com/... bit at the top of your web browser), and send it to your students. They do not need to log in and they do not need a Google Account to fill out the form. In fact anyone who knows the web address can fill out the form.
And that is that, you are now the proud owner of a GoogleDocs hosted spreadsheet creating form that has a nice chart to boot. I have opened the sample form I used for the screen shots, so you can access it through your Google Account. You can access the sample here.
Happy Googling!
